Model & method
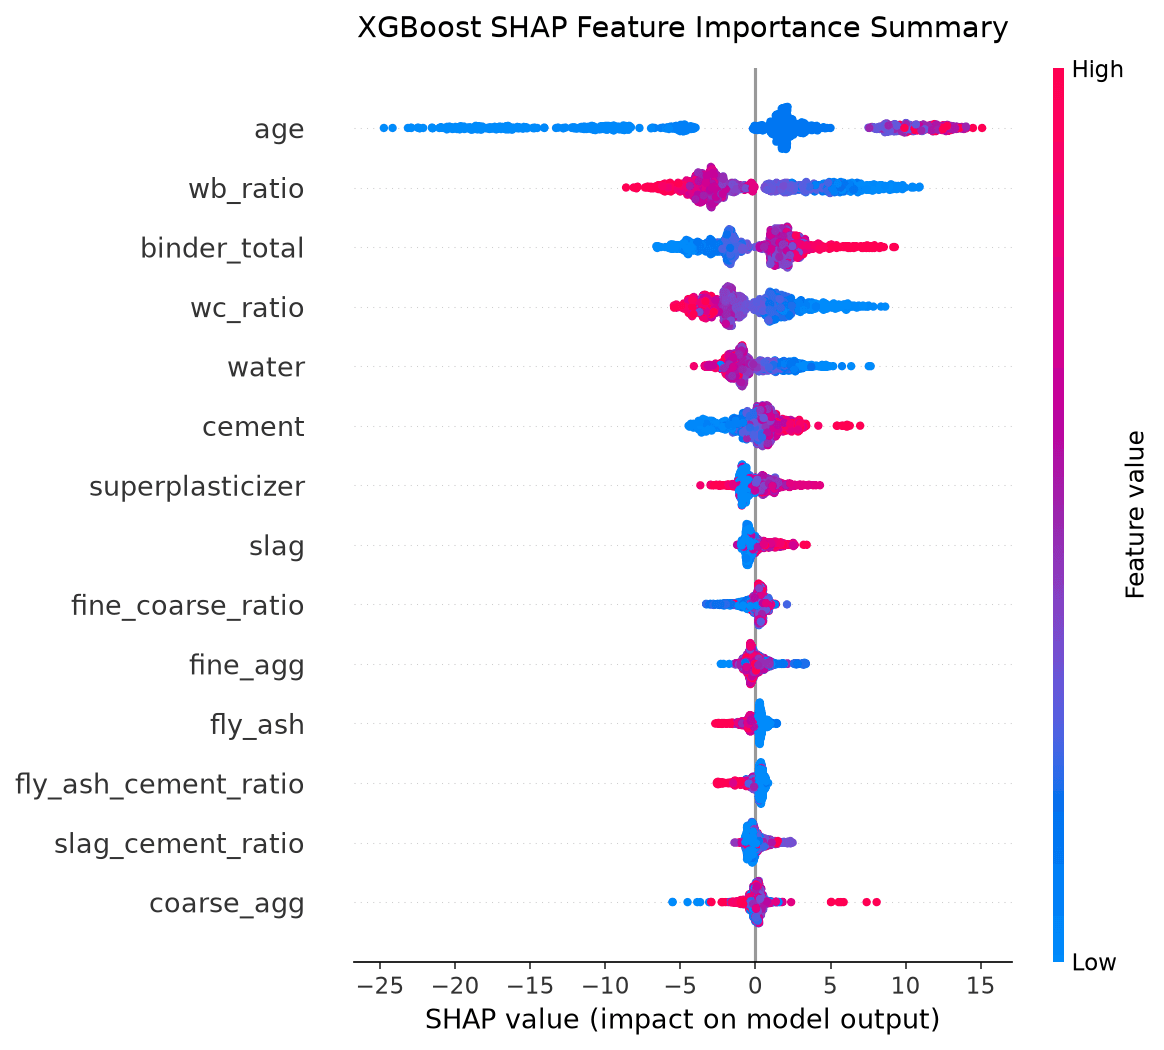
OptiMPa predicts the compressive strength of a concrete mix from its ingredients and curing age. The model is an XGBoost regressor trained on the UCI Concrete Compressive Strength dataset. It runs in your browser: the trained trees are shipped with the page, and SHAP values are computed exactly with TreeSHAP.
Data
UCI Concrete Compressive Strength (I-Cheng Yeh, 1998): 1030 laboratory tests. After removing 25 exact duplicate rows, 1005 observations of 428 different mixes remain, most of them tested at several ages.
| Input | Min | Max | Unit |
|---|---|---|---|
| Cement | 102 | 540 | kg/m³ |
| Blast Furnace Slag | 0 | 359.4 | kg/m³ |
| Fly Ash | 0 | 200.1 | kg/m³ |
| Water | 121.75 | 247 | kg/m³ |
| Superplasticizer | 0 | 32.2 | kg/m³ |
| Coarse Aggregate | 801 | 1145 | kg/m³ |
| Fine Aggregate | 594 | 992.6 | kg/m³ |
| Curing Age | 1 | 365 | days |
| Compressive strength | 2.33 | 82.6 | MPa |
The predictor warns when an input is outside these ranges, because the model is extrapolating there.
Method
Features.Besides the 8 raw inputs, the model gets the ratios that concrete technology says matter: water/cement (Abrams' law), water/binder, total binder, fine/coarse aggregate, and slag/cement and fly ash/cement.
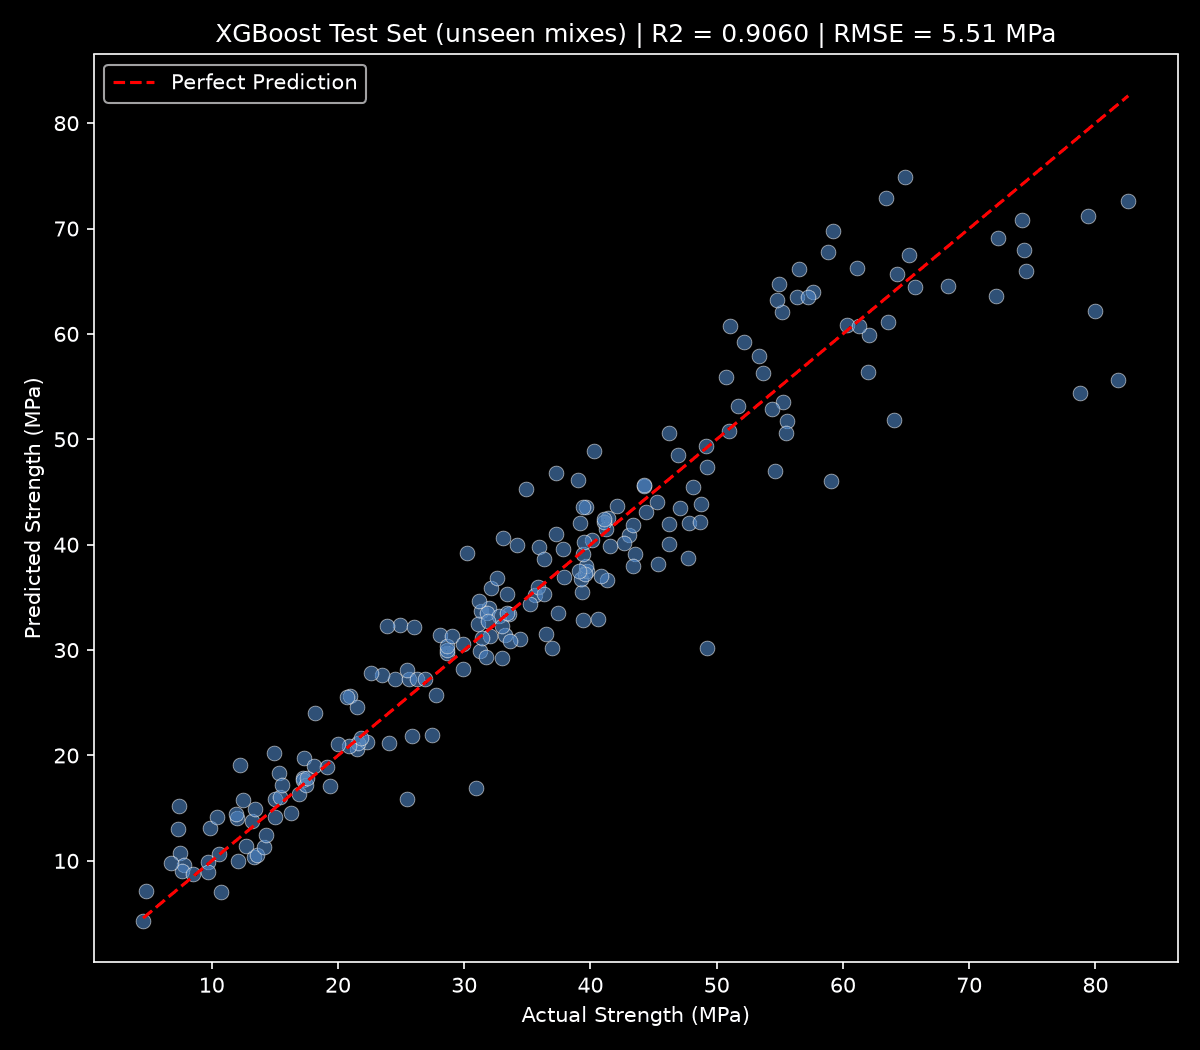
No leakage between train and test. The same mix is tested at several ages, so a random split would put the same mix in both sets and overstate the accuracy. Rows are grouped by mix design: 799 rows (80% of the mixes) are used for tuning with 5-fold GroupKFold, and 206 rows from mixes the model has never seen are held out for the final test.
Tuning. 50 Optuna trials (seeded), minimising the grouped cross-validation RMSE.
Results
| Model | CV R² | CV RMSE | Test R² | Test RMSE |
|---|---|---|---|---|
| Random Forest baseline (8 raw features) | 0.860 | 5.86 | 0.864 | 6.63 |
| XGBoost (14 features, tuned) | 0.900 | 4.93 | 0.906 | 5.51 |
RMSE is in MPa. On mixes it has never seen, the model is typically within about ±5.5 MPa, so treat a prediction as an estimate for comparing mixes, not as a replacement for testing.
Embodied carbon
The carbon of 1 m³ of concrete is each ingredient's mass (kg/m³) times its emission factor (kg CO₂e/kg), summed. This covers production of the materials (stages A1–A3, cradle to gate). Transport, reinforcement, formwork and later life stages are not included.
| Material | kg CO₂e per kg |
|---|---|
| Cement (CEM I) | 0.912 |
| Blast Furnace Slag (GGBS) | 0.083 |
| Fly Ash | 0.004 |
| Water | 0.000344 |
| Superplasticizer | 1.88 |
| Coarse Aggregate | 0.0075 |
| Fine Aggregate | 0.0075 |
These are approximate generic values, mostly from the ICE database v3.0 (Circular Ecology, 2019). The superplasticizer value is from the EFCA admixture EPD. They are good for comparing mixes with each other. For an actual assessment, use the EPDs of the specific cement and materials.
Reference mix. The predictor compares your mix with the same mix where all binder is Portland cement (slag and fly ash replaced 1:1 by mass), keeping the binder content and w/b ratio. Both are run through the strength model, so you see the carbon saved and what it costs in predicted strength.
Limitations
- One laboratory dataset of about 1000 tests. It has only cement, slag and fly ash as binders, so other binders (silica fume, calcined clay, limestone cement ...) can't be modelled.
- Strength is predicted as a mean cylinder strength. The EN 206 class is an estimate (fck = fcm − 8 MPa), not a conformity check.
- The carbon numbers use generic factors and cover the concrete only.
Tuned hyperparameters
| n_estimators | 705 |
| max_depth | 4 |
| learning_rate | 0.0473 |
| subsample | 0.677 |
| colsample_bytree | 0.530 |
| min_child_weight | 4 |
| gamma | 0.762 |
| reg_alpha | 1.04e-7 |
| reg_lambda | 0.0958 |